I feel as though we’ve been on a 2.5-year rollercoaster ride. It started in March of 2020 when the pandemic began, unemployment skyrocketed, and credit dried up as equity markets collapsed. Just a few short months later, the V-shaped recovery was starting to play out as governments around the world responded with financial stimulus to get economies back on solid footing. At about the same time, housing started a two-year tear that was euphoric for sellers and investors but mind-numbingly frustrating for many buyers. (I bought a house in December of 2020 and can personally attest to this.)
While the housing market tends to follow the macro-economic environment in many ways, it is a rather large market in and of itself. In this way, it tends to write its own story, penned by supply and demand fundamentals unique to what is one of the world’s largest asset classes.
Many believe that “as goes the economy, so goes housing,” largely as a result of what happened in 2008. However, if you look beyond the 2008 recession, the data tells a much different story. Over the past 55 years, there have been 8 recessions. In 3 of those recessions, housing prices went up. In 3, housing prices went down. And in 2, housing prices were relatively flat. In fact, in 2008 the economy went the way of housing--not the other way around. It’s important to note this distinction.
Housing Is Its Own Economy
Housing is certainly affected by the economy at large, particularly regarding the demand side of the equation. More employed people = more qualified buyers and more demand. Fewer employed people = fewer qualified buyers and less demand.
However, there is another important side of any economic equation--supply. To understand what’s been powering this rollercoaster ride over the past 2.5 years, and what we believe will continue to drive housing in the foreseeable future, let's explore the supply side of the story.
Housing Market Demand
To set the stage, we need to understand the current state of demand in a historical context and where this demand is coming from, both now and likely in the future. Let’s first talk about demand as of today (as of writing, the first week of July 2022). The below chart shows the Mortgage Bankers Association (MBA) Purchase Index for the last 5 years. This index tells us how many people are applying for a mortgage to purchase a home. You can see from 2018–2020 mortgage applications hovered around the 250 mark. When COVID-19 began, it created a huge dip that quickly rocketed above 300 for the rest of 2020 and into 2021. Toward the beginning of 2022, mortgage applications returned to over 300, and they’ve been on a downward trend since then as mortgage rates began to climb in February of this year. We’ve seen the 30-year mortgage rate over 5% since April, and mortgage applications are still staying in the range of 250, where demand was for most of 2018–2020.
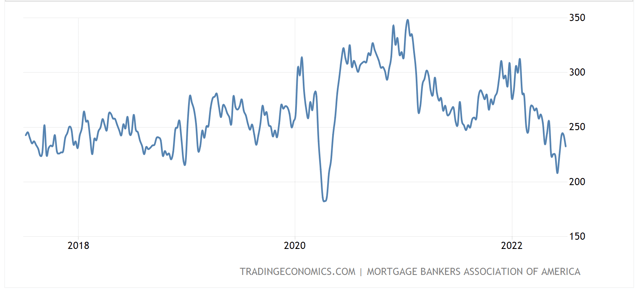 MBA Purchase Index: 5 Years
If we zoom out further and look at the same chart over a 10-year period, you’ll notice we saw much lower demand from 2013–2017. I started investing in real estate in 2013, we funded our first loans in 2015, and the market was plenty healthy during those years.
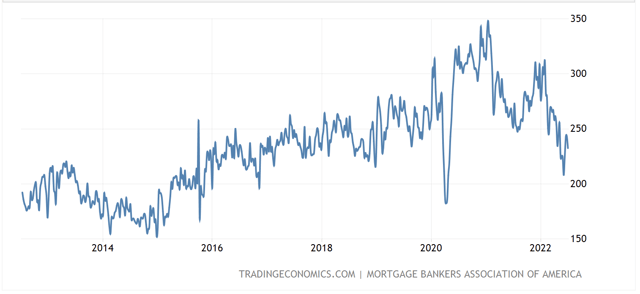 MBA Purchase Index: 10 Years
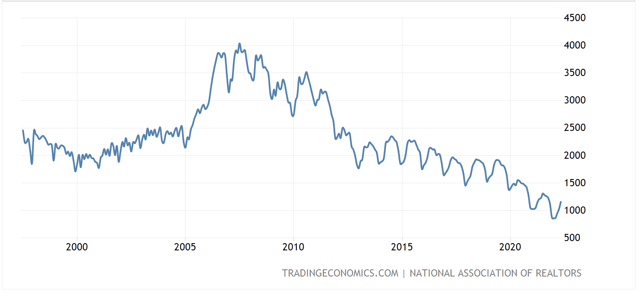
Looking at the same data over a 25-year period, we can see what the MBA Purchase Index looked like leading into the 2008 meltdown. The Purchase Index had peaked at more than 500 in 2005 and stayed well over 400 for several more years. This was artificial demand being supported by “creative” financing products, which led to runaway speculation and many unqualified buyers. This has not happened in the years leading up to where we’re at today.
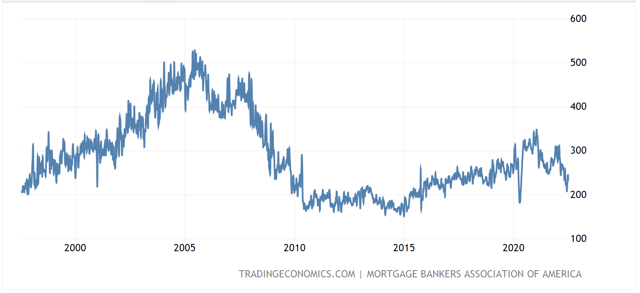 MBA Purchase Index: 25 Years
To summarize: demand is down from 2021 but is still within the range of what we consider normal over the past 12+ years.
"Demographics are Economics"
This begs the question: what’s driving demand? In a recent post by Logan Mohtashami (whom I recommend following), he writes “demographics are economics," and I couldn’t agree more. The largest cohort of the population in the U.S. is 22 to 40-year-olds: Millennials. This same behemoth of a population cohort only has a 48.6% homeownership rate. Long-range averages of homeownership tend to be 65%, meaning if you believe millennials want to own homes (and most economists believe they will), there is a lot of new demand still on the sidelines. Also worth mentioning is the cohort behind them, which represents the second-largest living generation who will begin entering home-buying age in the next 5 years.
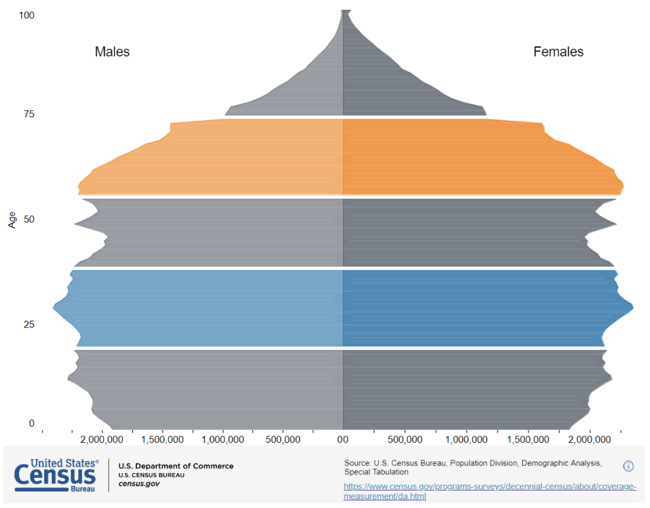 Population Division, Male and Female, by Age
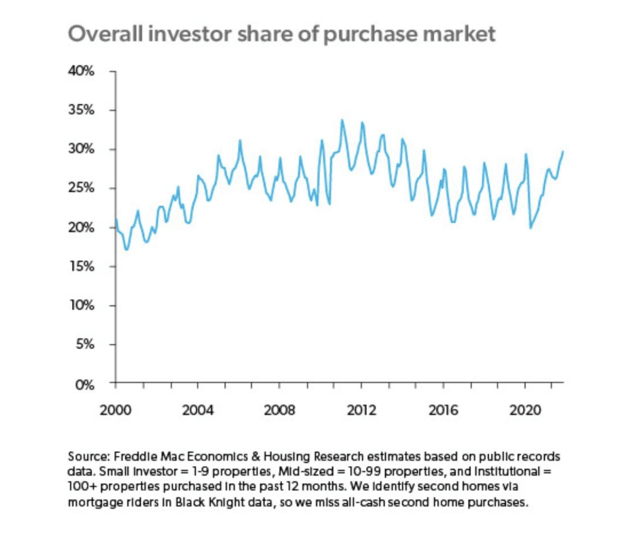
Next-- what about all these buyers, investors, and speculators? They seem to be a new force and partially to blame for the increase in housing prices. After all, these are the folks who got us to the 2008 crisis. Well, let’s look at the data. For the better part of 20 years, investors have made up between 20%–30% of the purchase market. On a percentage basis, they’re bringing as much demand to the market as they have in other time periods.
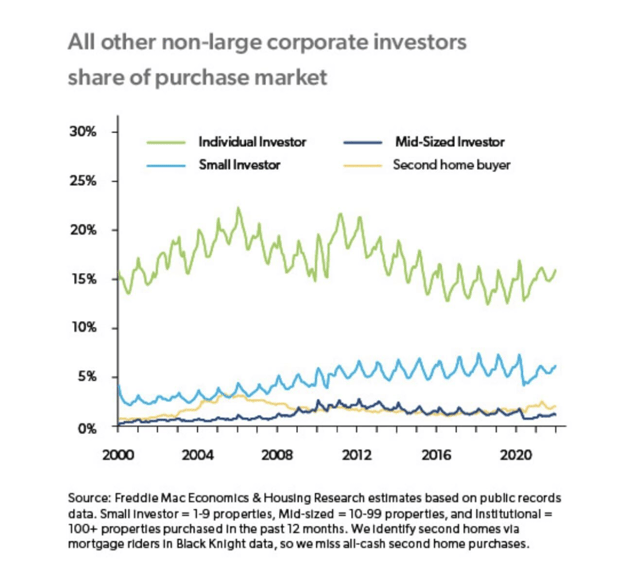
 When you break the data down further, we see that most of this activity is driven by the really small individual investor, people buying 1–9 properties. While the big buyers have entered the single-family market in a really noisy manner — in that they get a lot of press — they haven’t really moved the needle.
Demand Summary
Unlike the lead-up to 2008, housing demand is being driven by demographics rather than speculation and creative financial products. This means that unless millennials all of a sudden don’t need a place to live, this demand is likely to persist until homeownership rates for this cohort reach historical norms of ~65%.
It’s important to acknowledge this cohort may not all convert to homeowners, but we do believe they will be single-family home “livers” (i.e., as tenants of single-family homes). It’s outside the scope of this article, but a millennial who intends to rent a single-family house has a similar effect on the single-family housing market as a millennial who wants to buy — it's the same demand but expressed (that is, financed) differently.
Furthermore, the demand for purchase mortgages remains in the range of what is considered normal throughout the past 25 years. The headlines of double-digit decreases in demand, while technically accurate, miss explaining the point (and context) of the highs from which they are receding.
Will we see a pullback in demand as a result of higher mortgage rates and tougher economic times ahead? I think we certainly will--in fact, we are already seeing that. However, given the demographic forces at play, it’s our view that we will still see enough demand to support a healthy and more normal market.
Housing Market Supply
OK, so now the really good part: supply. Thanks for sticking with me this far because this is where it gets interesting.
Let's first anchor around some key points that are important to understand.
The first is Total Housing Inventory. This is the number of homes for sale on the market in a given month. As you can see from the chart below, as of this writing, there are around 1.2M homes listed for sale. This is down from a more normal range of 2M–2.5M typical of the last 25 years. You can see where the inventory levels became unhealthy during 2008 and how far away we are from those numbers. From a pure units-for-sale perspective, we have nearly half the amount of inventory we’d expect in a normal housing market.
 Total Housing Inventory
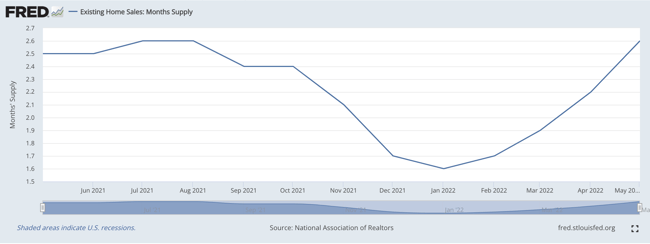
The second number we’ll be discussing is Months of Inventory (MoI). This metric factors in both the number of units available for sale as well as how quickly the units are selling. What it shows us is that if no other homes were listed for sale, how long would it take for everything to sell? This is expressed in a number of months. For example, per the chart below, we currently have 2.6 months of supply. If no new inventory came into the market, everything would be completely sold out in 2.6 months. Historically, in balanced markets, supply is typically 4-6 months.
 Months of Inventory
What you will notice from the above chart is that the trend is up. And I would argue this is a good thing. When supply is this low, the result is rapid home price appreciation, which ultimately is not sustainable or healthy for the long-term market. However, we’re still a long way away from the 4–6 month normal levels of supply.
So that begs the question, where does new supply come from? And in large part, there are really only 3 supply-creating events.
- Normal sellers: Folks that in the ordinary course of their life decide to sell their house.
- Distressed sellers: Folks that have run into some type of tough time and are forced to sell their house.
- New construction: New homes built as additional inventory to the market.
Normal Sellers
First up are folks who list their house for sale in what I’d term the “normal course of living.” They are moving for a job, want to upgrade or downsize, desire to get into a better school district for growing family, etc. While these moves may change the supply dynamics in that particular ZIP code, these moves don’t fundamentally change the overall supply as this seller is often also a buyer (i.e., they create 1 unit of supply but also consume 1 unit of supply). Again, while these sellers may impact supply on a micro-level (sell in ZIP code A and purchase in ZIP code B), they don’t change the overall supply dynamics, and thus we aren't going to spend much time here.
One note here is we believe there will be less liquidity in the for-sale market as a function of rising interest rates. Most homeowners locked in a 3% rate over the past year. Trading out of their current home means they give up that low-interest rate. While this group is supply neutral, I believe this is a net negative for supply, particularly in the first-time home buyer segment, as more folks are likely to stay in their smaller houses for longer.
Distressed Sellers
These are folks who must sell their home because of an adverse life event whereby they can no longer afford to make their mortgage payments and/or taxes. This may be a result of losing a job, getting divorced, passing away, or forming unproductive life habits.
The rate of divorce, death, and vice tends to be rather stable and largely doesn’t create a massive amount of supply all at once. The biggest and most systematic cause of an increase in supply due to distressed sellers is related to job losses caused by the larger economic environment. This can happen on a national level vis-a-vis recessions or on a more local level such as a downturn in tech or oil and gas, for example. When there are big spikes in unemployment, it creates situations where a lot of people all at once could become distressed sellers due to continued unemployment. These sellers typically go from homeowners to most likely renters or roommates (hi, Mom and Dad). This means not only is a new unit of supply hitting the market but a unit of demand is retreating.
This is the concern many people have today, particularly because this is what played out in 2008. As such, I’m going to spend some time examining the dynamics of this segment. As of July 2022, we all know that interest rates are up, inflation is at record highs, the stock market entered bear territory, and there is considerable talk about an impending recession (or whether we’re already in one). I’m not going to pretend to be intelligent enough to predict the next recession, but we can look at some data to help us understand how likely we’ll see a significant increase in supply as a result of an influx of distressed sellers as a result of the economy.
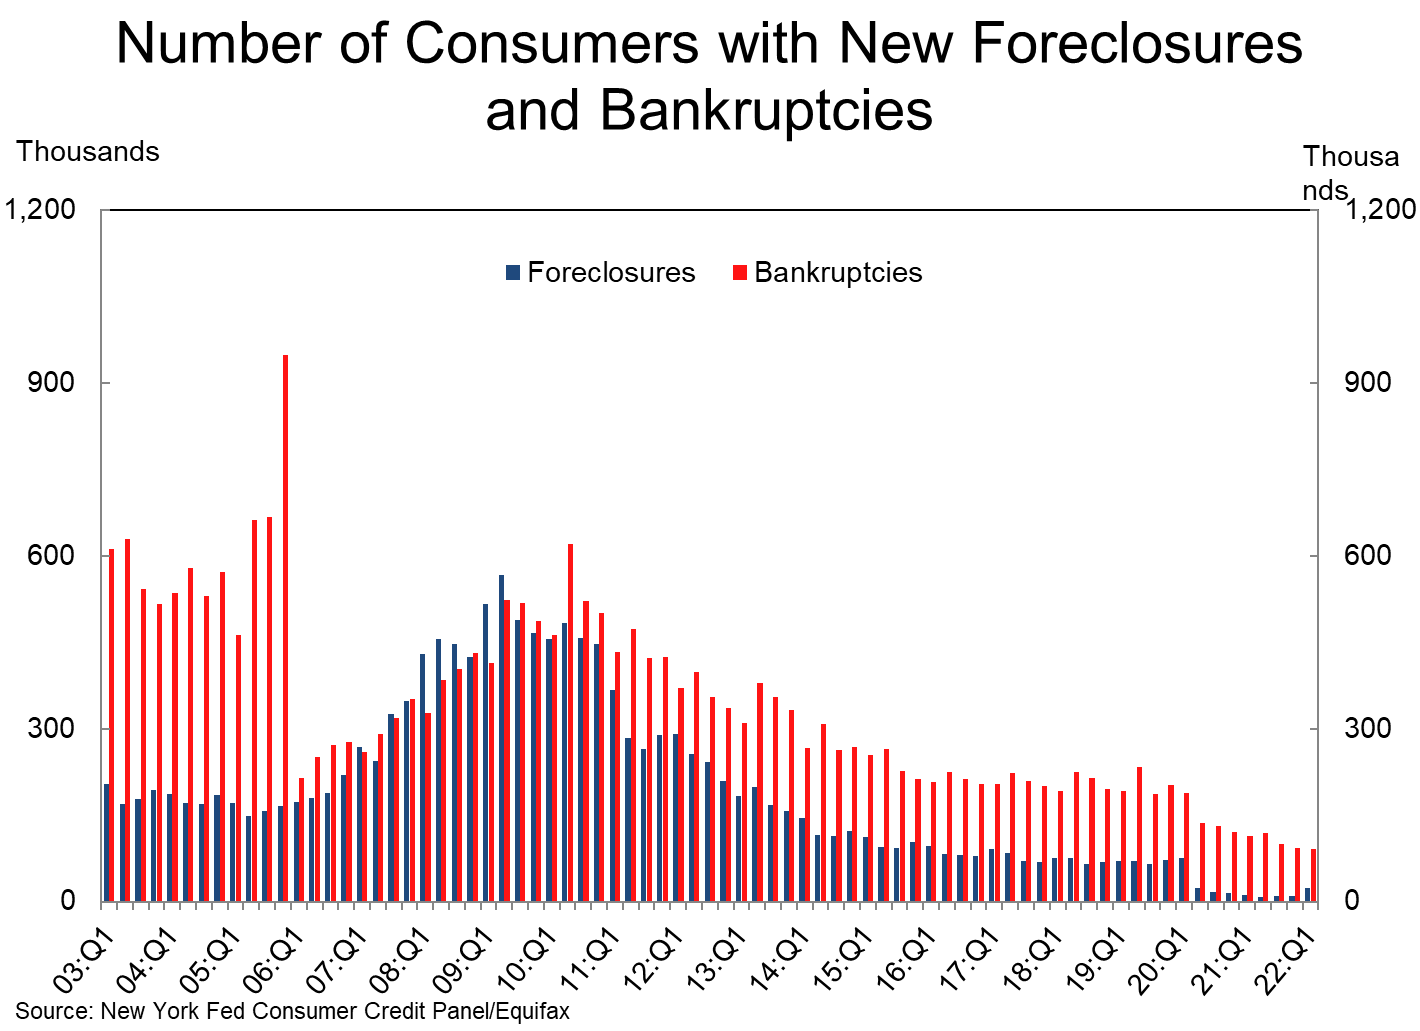
Let’s first look back at the years preceding 2008 to be able to contrast then and now. As the chart below shows, foreclosure activity started trending up in 2006, an early sign that the market was troubled. Looking at today, we have record lows of both foreclosures and bankruptcies. The homeowner and market are not signaling distress as we saw in the leadup to 2008.
The next data I think worth understanding is how leveraged the homeowner is as it relates to their mortgage payment. In the chart below, it shows mortgage debt service as a percentage of disposable income has also been lower than historical norms. This means that most mortgages people have taken out in the past 10 years are within their means. Notice how this contrasts with the lead-up to 2008.
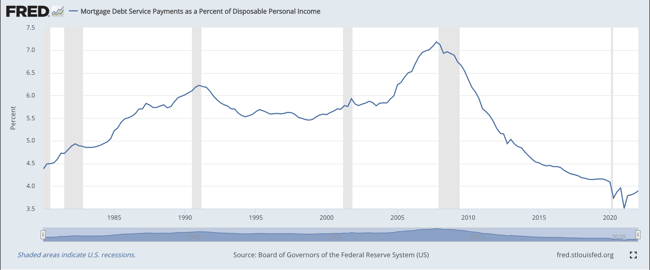 Mortgage Debt Service as a Percentage of Disposable Income
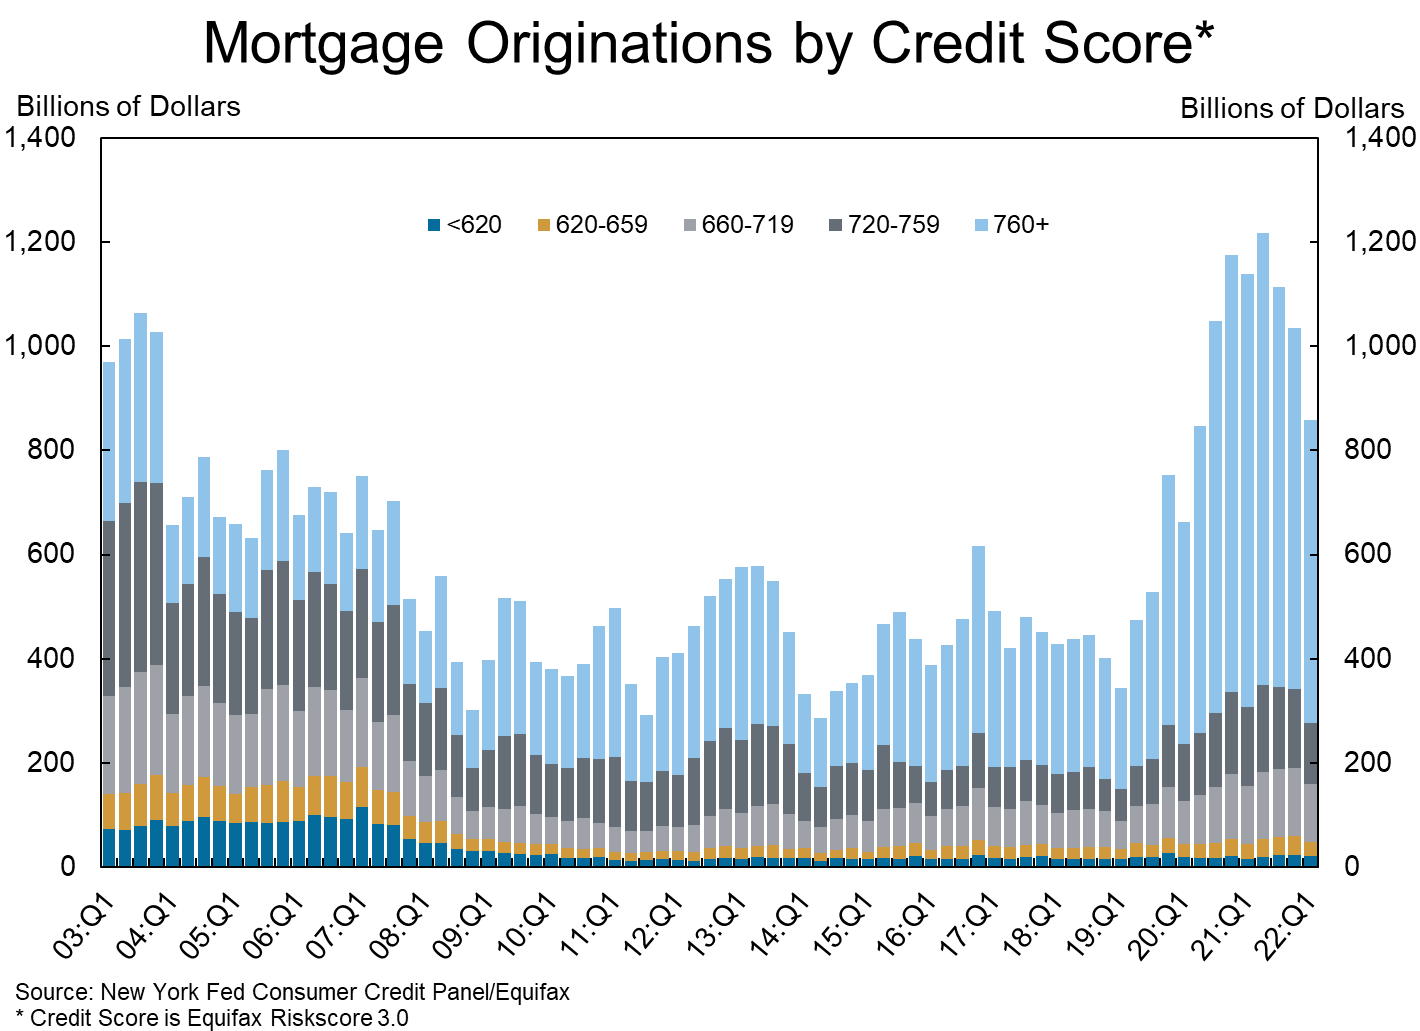
While I’m not a huge fan of credit scores and how much of the story they can tell, we do know they tell a pretty good story around financial responsibility. Higher credit generally correlates to one's ability to make payments on time and manage overall credit availability. Since 2008, a higher percentage of mortgages have been issued to Prime and Prime+ borrowers. FICO has been around a long time and is still a helpful risk indicator.
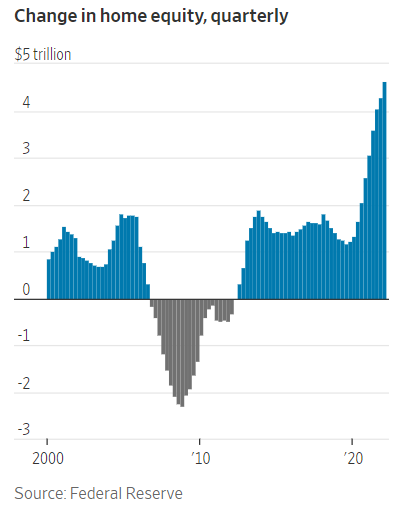
The last bit of data I’ll share as it relates to distressed sellers is the build-up in home equity. Across the board, there is now more than $4 trillion (with a t!) in equity in the housing stock. This is value above debt balances, which means that for most people who may experience economic hardship, there is stored value in their home. They are unlikely to give the keys back to the bank and walk away from the equity they’ve built by paying down their mortgages and the value of appreciation they've accrued.
And perhaps more importantly, it is my belief that most banks wouldn’t take the keys if handed to them. With this amount of equity, banks are going to be incentivized to work with their borrowers to keep people in their homes. There is an entire industry dedicated to this effort called non-performing to reperforming mortgages. Banks, both in economic terms and headline-risk terms, are going to do everything within their power to make sure a repeat of 2008 doesn’t happen. The amount of equity in homes gives them tools at their disposal they didn’t have leading up to 2008.
Distressed Seller Summary
The homeowner is undoubtedly under more stress now than they were 12 months ago. And they’re likely to continue to feel the added strain as inflation rages on and an economic winter advances. However, homeowners are entering this tough time on strong footing with a lot of equity, which gives them options beyond either fire selling their homes or turning them over to the bank.
Will there be foreclosures? Absolutely.
Will the number of foreclosures increase? Most certainly.
But keep in mind foreclosure rates will be increasing from incredibly low lows, and we’d need to see a significant amount of them in a short amount of time before they have a meaningful impact on overall supply.
New Construction
Finally, on to new construction. To understand this supply source, it's important to consider the supply dynamics of existing homes. As we saw earlier, the number of units is currently at 1.2M (remember, healthy is 2M–2.5M) and inventory is at 2.6 months (here, healthy is 4–6 months). So we’re vastly undersupplied right now.
In the housing market at large, there’s not much that is controllable by any one part of the ecosystem. Demand is dictated by interest rates, demographics, and the collective desires of individuals (we saw this play out as people fled cities for the ‘burbs during COVID). Existing home supply is dictated by when sellers want to sell, macro-economic events, and things as minute as how the local schools are doing at passing levies, for example.
As an industry, the one lever we have to pull to control some of this madness is how many new homes get built. The unfortunate thing about this lever is that it moves slowly. Assembling land to build on, securing permits, digging holes, and putting up sticks and bricks takes time. And because we operate in a free market, there are competing builders all trying to deliver the best product at the best time to optimize the supply and demand curve. It’s all incredibly complex, and homebuilders spend a lot of time and resources planning years out to get this balance right. Fortunately, we don’t have to have a Ph.D. to understand some of the basics driving the market and will likely continue driving the market for several years.
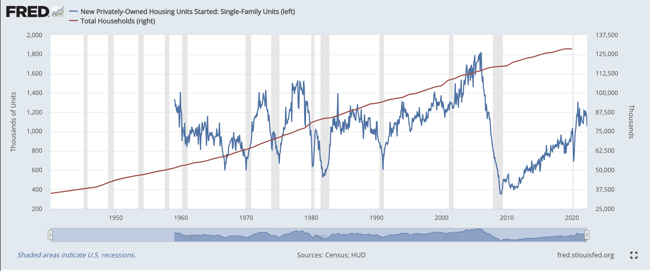
The below chart shows Total Households since the 1960s expressed as the red line (the value on the right axis). Total Households is the statistic used to measure how many groups of people are forming a household (i.e., a family). As you can see, we’ve had relatively consistent growth over the past 60 years.
The blue line represents Privately-Owned Housing Starts, which is fancy terminology for new homes being built. Going back to the '60s, while there are certainly some ups and downs with recessions (gray bars), the number of new single-family homes has averaged about 1M per year. If you believe in the invisible hand of the free market, this gives us a good sense of how much new housing we need to support the rather linear household growth, because more households require more housing.
There are some anomalies that show up going into 2008, which is that we built well over the 1M homes needed for a number of years. We all know this helped perpetuate the crisis of 2008.
But perhaps more interesting for us today is what happened between 2010 and 2020. The low amount of new builds certainly made some sense from 2010 to 2013 as that excess inventory from 2008 was absorbed into the market. However, from 2013 to 2020 the number of new homes being built was significantly below 1M — slowly creeping up to finally reach the historical average of 1M not until 2020. People smarter than I am have done the math and have estimated that over the past decade we underbuilt anywhere from 3M–5M homes.
 Privately-Owned Housing Starts vs. Total Households
As mentioned earlier, adding more houses via new construction is one of our only levers as an industry to try and find supply/demand equilibrium, but it’s a slow-moving lever. Home builders are also operating in much tougher environments. Finding land is challenging. Getting zoning approvals is challenging. Securing materials and labor, even before the pandemic, was challenging. To close the gap on the deficit of 3M–5M homes from 2013-present, builders would need to increase capacity significantly. Many builders are either unwilling (too much risk) or unable (constrained by land, labor, and materials) to do so. As a result, it’s the belief at Fund That Flip that we’ll be digging out of this housing shortage for at least the next decade.
But there’s a silver lining to this supply story. One of the benefits of this reality is that the risk of home builders building too many homes is greatly reduced, due to the fact that there is a massive shortage of supply. If you zoom in on the above chart you’ll notice builders are already reacting to the rising rate environment by slowing down starts. We think this also speaks to how risk-averse the industry has become as a result of 2008. We think is a healthy response while the market settles into a new rate environment and builders can adjust to the budgets of their buyers.
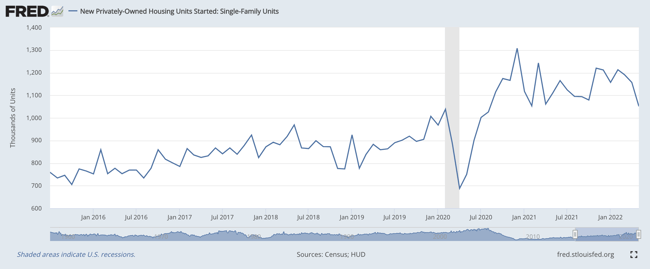 New Single-Family Housing Units Started
If you made it this far, here’s a gold star ⭐!
I’ll summarize quickly and give you an overview of how we at Fund That Flip are reacting to the current environment.
Summary
Demand is certainly softening--but softening from historic highs. We’ve returned to a range of normal for the time being. Here are a few things to watch to see how the demand curve may be changing:
- Interest rates: Most of the anticipated Fed increases are already priced into today’s mortgage rates. Nevertheless, rates rising over 6% and staying there would be noteworthy.
- Mortgage applications: These numbers update weekly and today are in a range we’d consider normal. Sustained demand under 200 on the MBA Purchase Index would be noteworthy. We expect this to hold between 200 and 250, and it hasn’t dropped below 200 since the 1990s.
- Days on Market: We didn’t get into this one in this post but will be covering it in subsequent posts. Houses are still selling really quickly, under 30 days. This will creep up — but don’t let the headlines scare you. We start to see the market go from seller advantaged to buyer advantaged when the days on market metric extends above 60 days.
- Sale to List: We also didn’t have time to discuss this one but this is the ratio of what a house sells for relative to what it is listed for. We’re currently over 100%. This is not normal. We expect the sale-to-list ratio to drop below 100%, and settle around 98%. You’ll know we have entered a buyers' market if it drops to 96%.
Supply is on the rise, and this is generally a good thing for the housing market at large. Too little supply creates unhealthy home price appreciation. The softening demand will help allow supply to return to normal. We don’t expect there to be an influx of supply caused by distressed sellers. The data just doesn’t support that story. Most of our new supply will come from new construction. The biggest challenge in this market is going to be people's ability to trade out of a starter home with their 3% mortgage rate into their new dream home, creating a healthy entry-level inventory and overall housing ecosystem. Here are a few things to keep an eye on:
- Total Housing Inventory: This is the number of homes for sale on the market. We’re currently at 1.2M. Normal is 2M–2.5M. As this approaches 2M, expect a more balanced market and home price appreciation to flatten.
- Months of Supply: Currently at 2.6 months, we’d like to see this back at 4 months of supply. If we run past 6 months, which we think is unlikely given the supply constraints, expect pricing to soften.
- New Home Starts: The magic number, assuming we hadn’t underbuilt the last decade, is 1M new home starts per year. This also assumes household formation holds steady (very likely, particularly in light of the millennial generation still getting married and starting families). I think we’ll see builders pull back for the remainder of 2022, which will only keep the overall inventory depressed. Once we see this number ticking back up, we’ll know builders have confidence in their abilities to deliver homes that meet the abilities/desires of their customers in this new rate environment. The market can probably sustain upward of 1.4M new homes per year, but don’t think the builder community has the risk tolerance to push there unless we see rates come back down.
Our bottom line analysis is that the housing market is in good shape. If anything, this rising rate environment will help the market over the long term as it takes some of the heat out and allows supply to catch up with demand. There will certainly be some bumps in the road, but we’re not headed for a repeat of 2008.
One last point about supply and demand is to reiterate that there’s no such thing as a national housing market. Each market has its own supply and demand fundamentals. In subsequent articles, we’ll be covering some of the core markets where we operate to give you a better sense of what’s happening in various cities around the country.
The Fund That Flip Response
As outlined above, we're bullish on the market at large. There remains solid demand, and we believe the market is going to find healthy support by the fact that we have a considerable supply shortage. That said, we’re adjusting our business to ensure we’re prepared for whatever may lie ahead. Below is a quick summary of all we’ve done and will continue to do to provide consistent results while this market readjusts to a new reality.
Tightened Underwriting: Starting in March we began making adjustments to our underwriting standards. This means lower loan-to-value (LTV) ratios, higher levels of diligence on our borrowers, increased experience, credit and liquidity requirements, and more. Our view is that while the market at large is strong, there are likely some bumps ahead, and we’d rather take a conservative approach for the benefit of our borrowers and investors. We’ll continue to make adjustments to this as additional data becomes available.
Increased Rates: It's no secret the cost of money has gone up. This means our investors expect a higher rate of return and we’ve calibrated our pricing accordingly. If you invest with us, you should have noticed higher rates over the past few months.
Asset Management: We’ve reallocated internal resources to become much more proactive on servicing our current book of business. We’re more frequently talking to our borrowers to understand the status of their projects, and developing plans where needed to ensure projects reach a successful conclusion. Partnering with clients during times of transition is paramount. I’m quite confident we're some of the best in the industry when it comes to managing a successful exit, and I’m committed to delivering great outcomes for both borrowers and investors.
Final Thoughts
The market has certainly entered a period of change. The headlines want you to believe we’re on the precipice of disaster (because that’s what sells), but the data tells a different story. We remain bullish because “demographics are economics” and the demographics are vastly in favor of single-family housing. The demand tailwinds are strong and while the wind may have shifted to a breeze, it's still blowing.
The real story here is supply — we don’t have enough houses and the only way to change that, in our view, is to build more houses. This is not an overnight fix, and we believe the builders are already doing what’s needed to calibrate supply to keep the system in balance. All said we’re taking measures at Fund That Flip to prepare for any outcome and are confident in our ability to deliver on our mission: building lasting relationships through extraordinary experiences, empowering investors to create wealth and improve communities.
Thank you for allowing us to pursue this mission with you!
Happy Investing,
Matt Rodak, CEO